Free Sales ROI Calculator:
Find the Return on Your Sales Investment
See how much revenue your sales team generates compared with its cost.
This is an example. Change the answers to match your team.
1 Team
2 Performance
3 Costs Advanced
Sales ROI compares the yearly value of new deals with the full cost of your sales team. It doesn’t include marketing, product, or delivery costs.
What the calculator does
It shows how much you get back for every dollar you spend on sales. This is your sales ROI (return on investment). The calculator counts the full cost of your team, not only salaries, so the result is closer to what you really spend. It uses only your numbers, with no industry averages added.
Sales ROI =
new revenue − sales cost
sales cost
($2.16M − $989k)
$989k
*If you add your gross margin in Costs, only the revenue you keep is counted.
Team
Your salespeople and what they earn.
Performance
How many deals you close, and what they’re worth.
Costs
Taxes, benefits, tools, and your gross margin.
When to check your sales ROI
Before you hire another salesperson
Add the new person in the calculator and see how your sales ROI changes.
Before the budget conversation
Have your sales ROI ready, based on your own numbers.
When you set next quarter’s targets
See how many deals a month cover your costs, then set your target above that.
When you review your sales tools
See how much of your sales cost goes to tools, and what changes if you add or remove one.
How to use it
Tips for a better sales ROI
Use last quarter’s real numbers
Take deals closed and deal size from your CRM (customer database) for the last three months, not from your plan. The result is only as good as the numbers you enter.
Find the steps that bring replies
In Dripify, on the Advanced plan, step analytics show the acceptance and reply rate of each step in a sequence. Keep the steps that work and remove the ones that don’t.
Free up time for conversations
Viewing profiles, sending connection requests, and following up take time for every lead. Dripify does these steps for you, so your team spends more of its day talking to people who replied.
Count the full cost of each salesperson
Salary and commission are only part of it. Taxes, benefits, and equipment add more. Set the payroll burden (the extra cost on top of pay) in Costs to your real number.
Use one tool for LinkedIn and email
Most sales tools charge per user. Dripify sends LinkedIn and email steps from one sequence, so one tool covers both channels.
Compare your team on the same numbers
In Dripify, team statistics show each person’s activity, acceptance rate, and reply rate. Export them for any dates to see who needs help.
Frequently Asked Questions
Take the new revenue your sales team generates, subtract what the team costs, and divide by the cost. If the team costs $1M a year and generates $2.2M in new revenue, sales ROI is 120%. Every dollar spent on sales returns $2.20.
OTE means on-target earnings: a salesperson’s base salary plus the commission they earn when they reach 100% of their target. For example, an account executive with a $60,000 base salary and $60,000 in commission at target has an OTE of $120,000.
Divide your monthly sales cost by your average deal size. With a sales cost of $82,000 a month and an average deal of $15,000, you need about 5.5 deals a month. The calculator shows this as break-even deals per month.
Your sales team’s job is to win new deals, so the calculator compares its cost with the yearly value of those deals (new ARR, annual recurring revenue). Renewals and upsells aren’t counted. Also, a new deal doesn’t pay its full yearly value in the first year: a deal signed in July pays about half of it by December.
Yes. Enter the average value of one deal as the deal size. The result then shows the return on one year of sales cost. If your customers buy again, the real return can be higher than the calculator shows.
More free tools
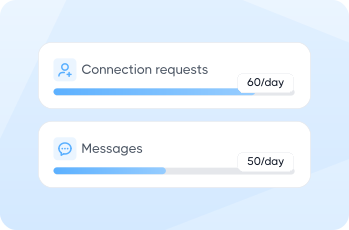
 When you’re guessing at your daily limits
LinkedIn Outreach Limits Calculator
See how many connection requests and messages your account can safely send in a day – before LinkedIn decides for you.
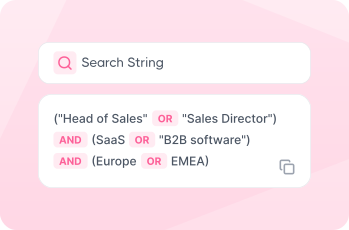
When your search finds the wrong people
LinkedIn Boolean Search Generator
Turn job titles and keywords into a search that finds the right people – no AND, OR, or NOT to memorize.