Had used Dripify before as well, and couldn’t stop vouching for it to my Senior. Dripify is that one tool which can make your Outbound Prospecting seamless. Excellent features, great UI/UX, and greater Onboarding + Support.
I’ve been using Dripify for four months and have found it very effective in building my network at a pace that I could not have imagined and to engage with new connections. The interface is easy to use and building campaigns and sequences is great.
Access an industry-leading LinkedIn analytics tool that provides key stats and metrics to help you make the right decisions
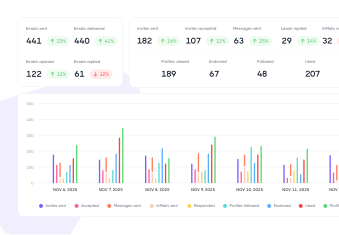
Overall account performance
Evaluate the performance of your entire Dripify account, get an overview of all key sales outreach metrics, and compare these stats with previous periods
Key campaign metrics
Monitor the performance of your LinkedIn and email campaigns in real-time, get instant alerts when results fall below average, and make data-driven decisions based on key metrics
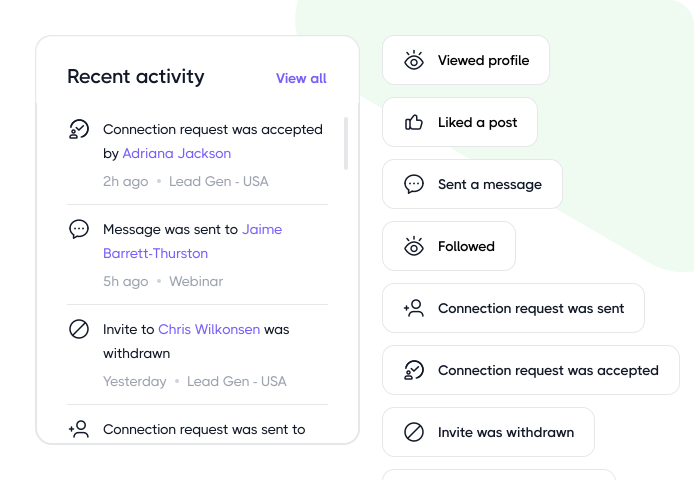
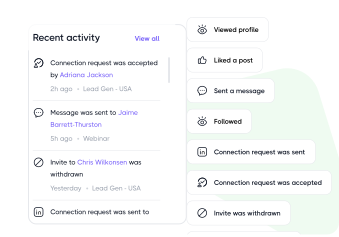
Recent activity
Not sure what’s happening in your account? Stay in control of your outreach by reviewing the timeline of recent LinkedIn actions and sent emails
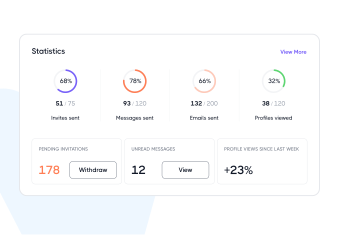
Daily usage stats
Track your daily usage stats to monitor how many LinkedIn actions and emails you’ve completed within your daily quota
1000+ Software
Integrate with the tools you already use
Native integrations and modern webhooks let you easily connect Dripify with all the software your team already uses
Great solution for any size company. The campaigns are easy to walk through and customizable.
Ayrton S.
Digital Marketing Specialist
It’s magic – and a massive time saver. The clever algorithm that keeps your account safe by ensuring you don’t go over LI limits. Helping me to build by connections with my target audience.
John Perkins
Director SparkLife
Extremely user-friendly, my first campaign is running, acceptance rate of 47%. Really a powerful tool to grow my reach on LinkedIn. The only remark I have is the limited speed of the campaign itself, but that is the nature of LinkedIn, not Dripify
Niels Fabry
Try out a smarter way to crush sales
Kickstart your sales outreach campaign today and see your first results in less than 48 hours, while enjoying your free trial
Frequently Asked Questions
Dripify calculates these metrics separately for LinkedIn and Email.
For LinkedIn outreach, Dripify counts acceptance rate based on how many of your connection requests get accepted, while response rate shows how many of your delivered outreach actions actually result in a reply.
Here’s how these are calculated:
LinkedIn Acceptance Rate: accepted connection requests ÷ total connection requests sent × 100. So, if you send 250 requests and 125 people accept, your acceptance rate is 50%.
LinkedIn Response Rate: number of leads that responded ÷ total number of leads reached via InMail, messages, and connection requests.
Email campaign analytics work a little differently. Dripify tracks both the Delivered (percentage of emails that successfully reached recipients’ mailboxes) and Replied (the number of leads that responded divided by the total number of leads to whom email was delivered).
Not directly. Acceptance and response rates aren’t currently filterable by date, so the percentages you see reflect the campaign’s lifetime performance.
You can still get the numbers for a particular period, though. Go to Statistics and select the date range you want to analyze. You’ll see the actual number of invites sent and accepted, messages delivered, and replies received during that period.
Dripify won’t calculate the percentage for that date range for you, but you can use those numbers to calculate it yourself. This method also gives you a cleaner month-over-month comparison, since older campaign results won’t skew the numbers.
No. Failed actions aren’t included as a separate metric in your regular Dripify statistics. Instead, Dripify tracks failures separately so you can see what went wrong and which leads were affected.
For example, an action can fail if you try to message someone who isn’t a 1st-degree connection, send an invitation to someone already in your network, or use a profile variable that Dripify can’t retrieve.
There are a few places where you can check what failed and which leads were affected:
Recent Activity: see Recent Activity from the upper-right corner of your Dashboard. If an action fails, you can spot the affected lead and the reason for the failure.
Lead profile: Open an affected lead and hover over the failure information to see why the action didn’t go through.
Campaign sequence: If an action has failed for certain leads, you’ll see a Failed indicator next to that step. Click it to see the leads Dripify couldn’t process.
Leads tab: Go to All leads → Failed to see failed leads, sorted by the reason they failed.
One important distinction: the Failed count you see in a campaign represents the number of failed leads, not the number of failed actions. These are leads that left the sequence because Dripify couldn’t perform an action for them. Your campaign’s Statistics tab, meanwhile, shows your regular campaign performance metrics rather than a separate count of failed actions.
Yes. Step-level analytics show how each individual action in your sequence performs, so you can see where leads engage and where they start dropping off.
That makes it much easier to figure out what actually needs fixing. If plenty of leads accept your connection request but responses fall off sharply after message 2, the message itself may need another look.
Currently, Step Analytics is available for Send Invite, Message, and Email actions. Support for the Sales Navigator InMail action is in progress and will be added soon.
Campaign-wide numbers can tell you that something isn’t working. Step-level data helps you narrow down where.
Sure. You can export your LinkedIn analytics report from Dripify in a couple of ways, depending on whether you need data for a specific campaign or your team.
For an individual campaign, go to the Campaigns tab and choose the campaign you need. Select the timeframe you want to report on: Today, Yesterday, Last 30 Days, Last 90 Days, or a custom date range, and click Export.
Your CSV will include invites sent, invites accepted, messages sent, InMails sent, leads replied, emails sent, profiles followed, profiles endorsed, posts liked, and profiles viewed, broken down by the selected period and with totals included.
If you’re managing a team, you don’t need to pull each member’s statistics one by one either. Go to Teams, select the members you want to include, click Export Data, and choose your date range. Dripify will generate a bulk report covering their outreach activity, from connection requests and messages to replies, emails, profile views, and more.
Your campaign’s lead data shows where each lead currently stands in the sequence. You can see who’s In Progress, Completed, Paused, Failed, Blacklisted, or Awaiting, making it easy to spot leads that are moving along and those that have stopped somewhere along the way.
For a closer look, check the Leads Queue at individual steps of your sequence. It shows how many leads are currently waiting to be processed at each action, and you can click a queue to see exactly who’s in it.
If you see Failed at a particular step, you can also open that list and check which leads failed and the exact reason why.
This is particularly useful when a campaign is active but the activity seems slower than expected: you can see whether leads are simply queued for their turn, awaiting something like a connection acceptance or reply, or failing at a particular action.
As a rough benchmark, LinkedIn campaigns average around 18% connection acceptance and 12% message response across the accounts we see. A well-targeted and properly personalized Dripify campaign will typically perform noticeably above both.
Still, don’t judge a campaign by acceptance rate alone. What matters more is whether those accepted connections turn into actual conversations.
You could have a 60% acceptance rate, but if nobody replies afterward, that impressive-looking number isn’t doing much for you. In that case, it’s a sign to take another look at your targeting and what happens after the connection is made.
Explore what else you can do with Dripify
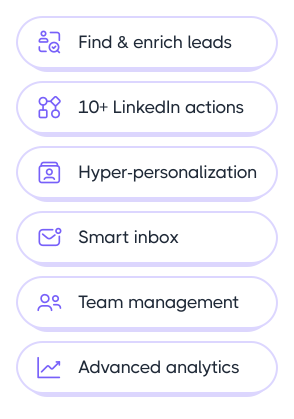
Discover other award-winning features of Dripify, the most trusted LinkedIn automation tool
Generate leads on LinkedIn
Reach the same leads on LinkedIn and book 3x more meetings than with email alone
Tell us the name of the software you wish to connect with Dripify and explain how exactly you intend to utilize this integration
Suggest an integration
Please fill the following fields to continue
Thanks a ton for suggesting your integration as the next one for us
We love that you took the initiative! We'll check it out and let you know the possibility to implement it in short term. Stay tuned for an update from us!
A/B test your message
Sign up here to be first in line when our exciting new feature rolls out
You’re on the list - stay tuned!
Awesome! Thanks for joining the waitlist! We'll reach out with an exclusive email when it's ready to launch. It might take a bit, but we promise to bring the news straight to you
Free 7-day trial. No credit card required. Cancel anytime
Select topics
Step 1/5
Thanks a ton for requesting your custom masterclass!
Ready to dive in? We hear you loud and clear! Just give our sales team a tiny bit of time to personalize your quote, and we'll be in touch within 24 hours.